Introduction: Why Economic Data Matters to Investors
Every month, financial markets react to a steady stream of economic reports.
Inflation rises unexpectedly, and stock prices fall. Employment growth slows, and bond yields decline. GDP exceeds forecasts, yet the stock market barely moves.
To inexperienced investors, these reactions can appear irrational.
Why would strong economic growth sometimes push stock prices lower? Why might markets rally after a disappointing employment report?
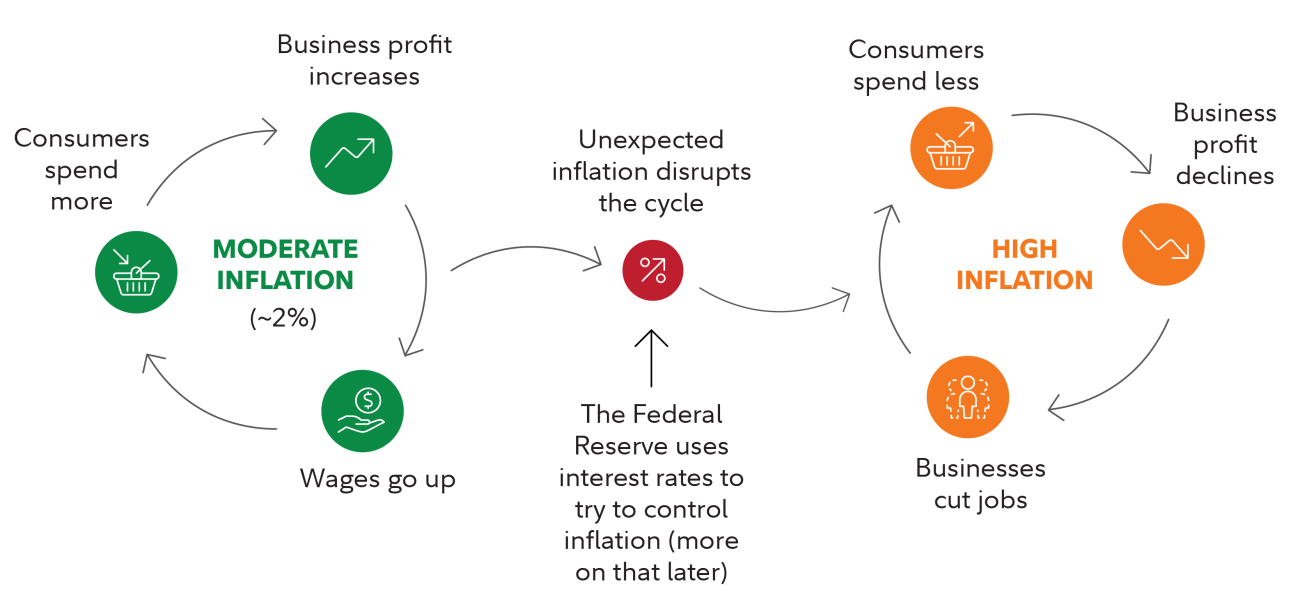
The answer is that financial markets respond not only to economic conditions but also to expectations about the future.
Economic indicators help investors evaluate three fundamental questions:
- Is the economy growing or slowing?
- Is inflation becoming more or less persistent?
- How might central banks respond to changing conditions?
Understanding these relationships can help investors make better decisions about portfolio risk, interest-rate exposure, and long-term financial planning.
You don’t need an economics degree to interpret the most important indicators. You need to understand what each measurement tells you, what it doesn’t tell you, and how different indicators interact.
1. Consumer Price Index (CPI): Understanding Inflation
The Consumer Price Index measures changes in the prices paid by consumers for a representative basket of goods and services.
In the United States, CPI data is published by the Bureau of Labor Statistics (BLS).
The index tracks prices across categories such as housing, transportation, food, healthcare, and other consumer expenditures.
How Inflation Is Calculated
The basic inflation formula is:
Inflation Rate = [(Current CPI − Previous CPI) ÷ Previous CPI] × 100
Suppose the CPI increased from 300 to 312 over one year.
The annual inflation rate would be:
(312 − 300) ÷ 300 × 100 = 4%
This means the measured consumer price level increased by 4% over that period.
It doesn’t mean every individual product became 4% more expensive.
Different goods and services experience different price changes, and individual households have different spending patterns.
Headline Inflation vs. Core Inflation
Economic reports frequently distinguish between headline and core inflation.
| Measure | What It Includes | Primary Use |
|---|---|---|
| Headline CPI | All categories in the CPI basket | Measures broad consumer price changes |
| Core CPI | Excludes food and energy | Helps assess underlying inflation trends |
| Headline PCE | Broad consumer expenditure prices | Important for Federal Reserve policy |
| Core PCE | PCE excluding food and energy | Additional view of inflation persistence |
Food and energy prices can fluctuate significantly due to weather, supply disruptions, and geopolitical events.
Removing these categories can make underlying inflation patterns easier to analyze.
However, core inflation shouldn’t be interpreted as the inflation people actually experience in their everyday budgets.
Food and energy remain important household expenses.
Why Investors Watch PCE Inflation
The Federal Reserve’s longer-run inflation objective is 2%, measured using the Personal Consumption Expenditures (PCE) price index.
CPI and PCE differ in their coverage, weighting, and calculation methods.
For investors tracking U.S. monetary policy, both measures provide valuable information.
The Difference Between Disinflation and Deflation
This distinction is frequently misunderstood.
Imagine annual inflation declines:
| Year | Inflation Rate |
|---|---|
| Year 1 | 6% |
| Year 2 | 4% |
| Year 3 | 2.5% |
Inflation is slowing, but the overall price level is still rising.
This is called disinflation.
Deflation occurs when the overall measured price level declines.
A reduction in inflation from 6% to 3% doesn’t mean products have become cheaper. It means their prices are increasing more slowly.
Practical Investor Insight
When analyzing inflation, review three elements:
- The latest month-over-month change.
- The year-over-year trend.
- Whether price increases are concentrated in a few categories or spread broadly across the economy.
A single favorable report doesn’t necessarily mean inflation has been defeated.
Look for a sustained pattern across several releases.
2. Understanding Monthly Inflation vs. Annual Inflation
Financial headlines often report monthly and annual inflation figures together.
These measurements answer different questions.
Year-over-year inflation compares prices with the same month one year earlier.
Month-over-month inflation measures changes from the preceding month.
Monthly changes can help identify recent momentum, while annual inflation provides a broader perspective.
Annualizing Monthly Inflation
Suppose consumer prices increase by 0.3% in one month.
If prices continued increasing at that same monthly rate for twelve consecutive months, the annualized inflation rate would be:
Annualized Inflation = [(1 + Monthly Rate)^12 − 1] × 100
Using 0.003 as the monthly rate:
[(1.003)^12 − 1] × 100 ≈ 3.66%
This doesn’t mean inflation will actually reach 3.66%.
It illustrates what would happen if the monthly rate persisted for an entire year.
For a more stable picture, analysts sometimes examine three-month or six-month annualized inflation.
These calculations can reveal changes in inflation momentum before they fully appear in the year-over-year figure.
However, short-term readings can be noisy, and annualizing temporary price movements may exaggerate their importance.
Practical rule: Examine both the recent trend and the longer-term trend before drawing conclusions.
3. Employment Reports: Looking Beyond the Headline Jobs Number
Employment is one of the most closely followed indicators of economic health.
In the United States, the monthly Employment Situation report provides information about job growth, unemployment, wages, and hours worked.
The BLS uses two major surveys.
The Establishment Survey
This survey collects information from employers and measures:
- Nonfarm payroll employment.
- Average hourly earnings.
- Average weekly working hours.
- Employment changes across industries.
The headline monthly jobs figure generally comes from this survey.
The Household Survey
The household survey measures labor force characteristics, including:
- Employment status.
- Unemployment.
- Labor force participation.
- Demographic labor market trends.
The surveys use different definitions and methodologies, so their results won’t always move in the same direction.
Understanding the Unemployment Rate
The standard unemployment rate is calculated as:
Unemployment Rate = Unemployed People ÷ Labor Force × 100
Suppose an economy has:
- 100 million employed people.
- 5 million unemployed people actively seeking work.
The labor force equals 105 million.
Unemployment rate:
5 million ÷ 105 million × 100 ≈ 4.76%
However, an important detail is that people who are not employed but aren’t actively seeking work generally aren’t classified as unemployed under the standard measure.
This creates an important analytical limitation.
A falling unemployment rate isn’t always evidence of a strengthening labor market.
It can sometimes occur when people leave the labor force.
Three Employment Metrics Worth Monitoring
| Indicator | Stronger Labor Market May Show | Weaker Labor Market May Show |
|---|---|---|
| Payroll employment | Sustained job gains | Slowing or declining employment |
| Unemployment rate | Stable or declining rate with healthy participation | Persistent increases |
| Average weekly hours | Stable or increasing hours | Reduced working hours |
Employment trends should be evaluated together rather than separately.
For example, employers may reduce working hours before making widespread layoffs.
A decline in average weekly hours can therefore provide useful context even while headline employment remains positive.
Don’t Ignore Jobs Report Revisions
Initial payroll estimates are regularly revised as additional information becomes available.
Suppose a report initially shows 200,000 new jobs.
The following month, the number is revised to 150,000.
The revision is:
150,000 − 200,000 = −50,000 jobs
The original figure overstated the subsequently estimated increase by 50,000 jobs.
A single revision doesn’t necessarily signal an economic downturn.
However, repeated downward revisions combined with deteriorating employment indicators may suggest weaker labor market conditions than initially reported.
4. Gross Domestic Product (GDP): Measuring Economic Growth
Gross Domestic Product measures the value of final goods and services produced within an economy over a specified period.
GDP is commonly used to assess overall economic activity.
One standard expenditure-based framework is:
GDP = C + I + G + (X − M)
Where:
- C: Personal consumption expenditures.
- I: Gross private domestic investment.
- G: Government consumption expenditures and gross investment.
- X: Exports.
- M: Imports.
The distinction between nominal and real GDP is especially important.
Nominal GDP vs. Real GDP
Nominal GDP measures economic output using current prices.
Real GDP adjusts for price changes to provide a better measure of changes in actual production.
Consider a simplified example:
| Year | Units Produced | Price per Unit | Nominal Output |
|---|---|---|---|
| Year 1 | 1,000 | $10 | $10,000 |
| Year 2 | 1,000 | $11 | $11,000 |
Nominal output increases by 10%.
But the number of units produced hasn’t changed.
The increase comes entirely from higher prices.
Real output growth would be zero in this simplified example.
This is why investors should usually examine real GDP growth when evaluating economic expansion.
Understanding Annualized GDP Growth
U.S. quarterly real GDP growth is commonly reported at a seasonally adjusted annual rate.
This can be confusing.
If the reported annualized quarterly growth rate is 3%, the economy didn’t necessarily grow by 3% during that single quarter.
The approximate corresponding quarterly rate is:
Quarterly Growth = (1 + Annualized Rate)^(1/4) − 1
For an annualized rate of 3%:
(1.03)^(1/4) − 1 ≈ 0.74%
Therefore, 3% annualized quarterly growth corresponds to approximately 0.74% growth during that quarter.
Why GDP Revisions Matter
The U.S. Bureau of Economic Analysis publishes multiple estimates for each quarter.
The advance estimate uses information available relatively soon after the quarter ends.
Later estimates incorporate additional data.
Investors should avoid treating the initial GDP release as a final, perfectly precise measurement.
Look Beneath the GDP Headline
A positive GDP number doesn’t automatically indicate broad economic strength.
For example, growth driven primarily by inventory accumulation may tell a different story from growth supported by sustainable consumer spending and business investment.
When examining GDP reports, consider:
- Personal consumption growth.
- Business fixed investment.
- Inventory contributions.
- Government spending.
- Net exports.
- Real final sales to private domestic purchasers.
The final measure can help assess underlying private domestic demand by focusing on consumer spending and private fixed investment.
Practical insight: The composition of economic growth can matter as much as the headline growth rate.
5. Interest Rates and the Treasury Yield Curve
Interest rates influence borrowing costs, asset valuations, housing markets, corporate investment, and consumer spending.
The Federal Reserve influences short-term interest rates primarily through its monetary policy tools.
However, longer-term bond yields also reflect expectations about future rates, inflation, and risk.
What Is the Yield Curve?
The Treasury yield curve compares yields on U.S. government securities across different maturities.
Under many normal market conditions, longer-term securities offer higher yields than shorter-term securities.
But this relationship isn’t guaranteed.
Normal vs. Inverted Yield Curves
Consider two hypothetical situations.
| Treasury Maturity | Normal Curve | Inverted Curve |
|---|---|---|
| 2-year yield | 3.0% | 4.5% |
| 10-year yield | 4.0% | 3.8% |
| 10Y–2Y spread | +1.0% | -0.7% |
The difference between the ten-year and two-year yields is a commonly watched measure.
Yield Spread = 10-Year Treasury Yield − 2-Year Treasury Yield
For the inverted example:
3.8% − 4.5% = −0.7 percentage points
That equals −70 basis points.
An inverted curve means shorter-term yields exceed longer-term yields.
Why Yield Curve Inversions Attract Attention
An inverted yield curve can reflect expectations that future short-term interest rates will decline.
This may occur when investors anticipate slower economic growth or weaker inflation.
Historically, certain yield curve inversions have preceded U.S. recessions.
However, they are not reliable countdown timers.
An inversion doesn’t prove that a recession will occur, and the time between an inversion and any subsequent recession can vary substantially.
Yield curves also reflect term premiums, bond supply, investor demand, and other market factors.
A More Useful Way to Interpret the Curve
Rather than treating an inversion as a trading signal, compare it with other indicators.
For example:
- Is unemployment beginning to rise?
- Is consumer spending weakening?
- Are credit conditions becoming tighter?
- Are businesses reducing hiring and investment?
- Is inflation declining enough to allow easier monetary policy?
A yield curve inversion combined with widespread economic deterioration may deserve more attention than an inversion occurring alongside strong employment and resilient spending.
6. Why Good Economic News Can Be Bad for Stocks
One of the most useful lessons for investors is that economic news and market performance aren’t the same thing.
Imagine a monthly employment report showing substantially stronger job growth than economists expected.
At first glance, that seems positive.
Companies are hiring, households may have more income, and the economy appears resilient.
However, financial markets might interpret the same report differently.
Strong employment could suggest persistent wage pressure and inflation.
Investors might then expect the central bank to maintain higher interest rates for longer.
Higher discount rates can reduce the present value of expected future corporate earnings, potentially pressuring stock valuations.
As a result, stocks could decline following stronger-than-expected employment data.
The reverse can also happen.
A slightly weaker jobs report might increase expectations of future interest-rate cuts, supporting stock valuations under certain conditions.
But severe labor market weakness can also damage earnings expectations and increase credit risk.
Therefore, weaker economic data isn’t automatically good for markets.
The Importance of Expectations
Financial markets are forward-looking.
The immediate market response often depends on the difference between actual data and what investors had already anticipated.
Consider this hypothetical example:
| Indicator | Market Forecast | Actual Result |
|---|---|---|
| Annual CPI inflation | 3.4% | 3.1% |
| Monthly payroll growth | 180,000 | 120,000 |
| Annualized real GDP growth | 2.0% | 2.4% |
The CPI figure came in below expectations.
Payroll growth was weaker than expected.
GDP growth exceeded expectations.
An investor shouldn’t simply label the entire data set as good or bad.
Instead, examine how the results affect anticipated inflation, economic growth, corporate earnings, and monetary policy.
7. Build a Simple Macroeconomic Dashboard
You don’t need expensive financial terminals to monitor the economy.
A spreadsheet containing a handful of consistently tracked indicators can provide a useful overview.
Here is an example.
| Indicator | What to Track | Important Question |
|---|---|---|
| CPI | Monthly and annual change | Is inflation accelerating or slowing? |
| Core PCE | Recent and annual trend | Is underlying inflation becoming more persistent? |
| Payroll growth | Monthly change and revisions | Is hiring strengthening or weakening? |
| Unemployment | Rate and recent trend | Is labor market stress increasing? |
| Average weekly hours | Monthly and 3-month trends | Are employers reducing labor demand? |
| Real GDP | Quarterly annualized growth | Is economic production expanding? |
| Treasury yields | 2-year and 10-year yields | How is the interest-rate outlook changing? |
| Yield spread | 10-year minus 2-year yield | Is the curve steepening or flattening? |
How to Use the Dashboard
Step 1: Record the Latest Data
Use official statistics rather than relying exclusively on social media summaries.
Step 2: Include Previous Results
A single release provides limited context.
Track at least three to six observations for monthly indicators where appropriate.
Step 3: Record Revisions
Maintain both the previously reported and latest revised numbers for indicators that are regularly revised.
Step 4: Look for Consistent Trends
Consider whether multiple indicators support the same economic interpretation.
Step 5: Separate Analysis From Investment Decisions
A weakening economic outlook doesn’t automatically mean selling stocks.
Your portfolio allocation, investment horizon, valuation assumptions, and risk tolerance still matter.
The dashboard should improve your understanding, not encourage constant trading.
8. A Practical Example: Analyzing Mixed Economic Signals
Let’s examine a hypothetical economic environment.
Over several months, the following changes occur:
| Indicator | Earlier Reading | Latest Reading |
|---|---|---|
| Annual CPI inflation | 4.5% | 3.2% |
| Unemployment rate | 3.8% | 4.3% |
| Monthly payroll growth | +220,000 | +90,000 |
| Annualized real GDP growth | 2.8% | 1.4% |
| 10-year Treasury yield | 4.5% | 3.9% |
These numbers are illustrative, not a description of current economic conditions.
Step 1: Interpret Inflation
Inflation is slowing.
This may reduce some pressure for restrictive monetary policy, although the latest inflation rate could still be above the central bank’s objective.
Step 2: Evaluate Employment
The unemployment rate has increased and payroll growth has slowed.
This suggests potential weakening in labor demand.
However, further evidence is needed to determine whether the changes represent a temporary slowdown or a more sustained deterioration.
Step 3: Examine GDP
Real GDP growth has moderated.
The economy is still expanding in this example, but at a slower pace.
Step 4: Interpret Bond Yields
The ten-year Treasury yield has declined.
This could reflect weaker expected growth, lower inflation expectations, changing policy expectations, or movements in the term premium.
The yield change alone cannot identify the cause.
Step 5: Develop a Balanced Conclusion
Taken together, these indicators suggest an economy experiencing slower growth and reduced inflation pressure.
But they don’t prove that a recession is inevitable.
Nor do they establish that bond prices will continue rising or that stocks must decline.
A disciplined investor would use this information to assess portfolio resilience, liquidity needs, and exposure to economic risks.
The objective is to understand the environment rather than make confident predictions from incomplete evidence.
9. Five Common Economic Data Mistakes
Mistake 1: Confusing Falling Inflation With Falling Prices
Inflation declining from 5% to 3% means prices are generally rising more slowly, not necessarily falling.
Mistake 2: Focusing Only on Headline Numbers
A strong GDP report driven by unusual inventory movements may carry different implications from strong consumer demand.
A positive jobs report accompanied by falling working hours may indicate a more complicated labor market picture.
Mistake 3: Ignoring Data Revisions
Economic statistics are estimates produced from available information.
Revisions can materially change the interpretation of earlier releases.
Mistake 4: Treating One Indicator as a Guaranteed Forecast
An inverted yield curve, rising unemployment, or slowing GDP can signal risks.
None guarantees a particular market outcome.
Mistake 5: Making Large Portfolio Changes After Every Release
Markets absorb new information quickly, and many economic expectations are already reflected in asset prices.
Frequent portfolio changes based on individual reports can increase trading costs and expose investors to unnecessary timing risk.
10. Where to Find Reliable Economic Data
For investors who want to perform independent analysis, primary sources should be the foundation.
| Source | Best For | Website |
|---|---|---|
| Bureau of Labor Statistics | Inflation, employment, wages | bls.gov |
| Bureau of Economic Analysis | GDP, PCE inflation, consumption | bea.gov |
| Federal Reserve | Monetary policy, financial conditions | federalreserve.gov |
| U.S. Treasury | Government bond yields | home.treasury.gov |
| FRED, Federal Reserve Bank of St. Louis | Historical economic data and charts | fred.stlouisfed.org |
These sources help distinguish actual published statistics from interpretations or predictions.
When comparing releases, always check the reference period, units, seasonal adjustment, and publication date.
For example, comparing a monthly inflation figure with a quarterly annualized GDP number without recognizing their different measurement conventions can lead to incorrect conclusions.
Frequently Asked Questions
Which economic indicator is most important for the stock market?
There is no single most important indicator.
Inflation, employment, GDP, interest rates, corporate earnings, and financial conditions all influence stock valuations.
Their relative importance changes depending on the economic environment.
Does lower inflation always mean lower interest rates?
No.
Central banks evaluate inflation trends alongside employment, economic growth, financial stability, and future expectations.
A reduction in inflation may support lower policy rates, but it doesn’t guarantee an immediate rate cut.
Can GDP grow while unemployment rises?
Yes.
Economic output can increase even when labor market conditions weaken, particularly when productivity improves or the benefits of growth are concentrated in certain sectors.
Does an inverted yield curve guarantee a recession?
No.
Yield curve inversions have historically been associated with increased recession risk, but they don’t provide certainty about whether or when a recession will occur.
Should beginners trade immediately after economic reports?
Generally, inexperienced investors should be cautious about short-term trading based on economic announcements.
Price movements can be rapid and unpredictable, while transaction costs, spreads, and volatility may increase around important releases.
Understanding economic indicators is useful even when you choose not to trade on them.
Conclusion: Think in Trends, Not Headlines
Economic indicators provide valuable insight into the health and direction of financial markets.
But their usefulness depends on interpretation.
CPI and PCE help measure inflation.
Employment reports provide insight into labor market conditions.
GDP measures economic output.
Treasury yields reflect multiple influences, including expectations for future interest rates, inflation, and economic growth.
None of these indicators should be analyzed in isolation.
The most effective approach is to examine how multiple data points interact, compare results with expectations, and distinguish short-term fluctuations from sustained changes.
For long-term investors, this knowledge can improve risk awareness and support more informed financial decisions.
You don’t need to predict every recession, inflation surprise, or central bank decision to become a better investor.
The real advantage comes from understanding what economic data actually says—and recognizing what it cannot tell you.
References and Further Reading
- U.S. Bureau of Labor Statistics — Consumer Price Index
- U.S. Bureau of Labor Statistics — Employment Situation
- U.S. Bureau of Economic Analysis — Gross Domestic Product
- U.S. Bureau of Economic Analysis — Personal Consumption Expenditures Price Index
- Federal Reserve — Monetary Policy Goals
- U.S. Treasury — Interest Rate Statistics
- Federal Reserve Bank of St. Louis — FRED Economic Data